(5) #54 Oregon State (14-6)

1715.45 (26)

Click on column to sort  • 
# Opponent Result Effect Opp. Delta % of Ranking Status Date Event
51 British Columbia-B Win 8-7 7.49 21 4.65% Counts Feb 1st Stanford Open Womens
133 Cal Poly-SLO-B Win 13-7 -5.38 113 5.23% Counts (Why) Feb 1st Stanford Open Womens
35 Carleton College-Eclipse Win 9-8 18.82 23 4.95% Counts Feb 1st Stanford Open Womens
51 British Columbia-B Win 10-7 21.77 21 4.95% Counts Feb 2nd Stanford Open Womens
135 Stanford-B Win 8-5 -9.67 66 4.33% Counts (Why) Feb 2nd Stanford Open Womens
68 Santa Clara Loss 9-11 -20.82 62 5.23% Counts Feb 2nd Stanford Open Womens
65 Portland Win 9-7 9.62 22 4.8% Counts Feb 2nd Stanford Open Womens
72 Colorado College Win 10-6 18.05 30 5.09% Counts (Why) Feb 8th DIII Grand Prix 2025
61 Lewis & Clark Win 12-10 10.51 13 5.54% Counts Feb 8th DIII Grand Prix 2025
121 Puget Sound Win 12-5 3.16 17 5.32% Counts (Why) Feb 8th DIII Grand Prix 2025
44 Whitman Loss 7-13 -25.94 8 5.54% Counts Feb 8th DIII Grand Prix 2025
35 Carleton College-Eclipse Loss 10-12 -0.1 23 5.54% Counts Feb 9th DIII Grand Prix 2025
122 Claremont Win 13-5 2.07 72 5.54% Counts (Why) Feb 9th DIII Grand Prix 2025
65 Portland Loss 10-12 -19.17 22 5.54% Counts Feb 9th DIII Grand Prix 2025
206 Cal Poly-Humboldt** Win 13-2 0 83 0% Ignored (Why) Mar 8th PACcon
234 Lewis & Clark -B** Win 11-2 0 56 0% Ignored (Why) Mar 8th PACcon
22 Western Washington Loss 10-12 22.3 7 6.98% Counts Mar 8th PACcon
61 Lewis & Clark Win 11-10 4.95 13 6.98% Counts Mar 9th PACcon
173 Pacific Lutheran Win 11-7 -33.19 39 6.8% Counts Mar 9th PACcon
22 Western Washington Loss 5-13 -4.86 7 6.98% Counts (Why) Mar 9th PACcon
**Blowout Eligible. Learn more about how this works here.

FAQ

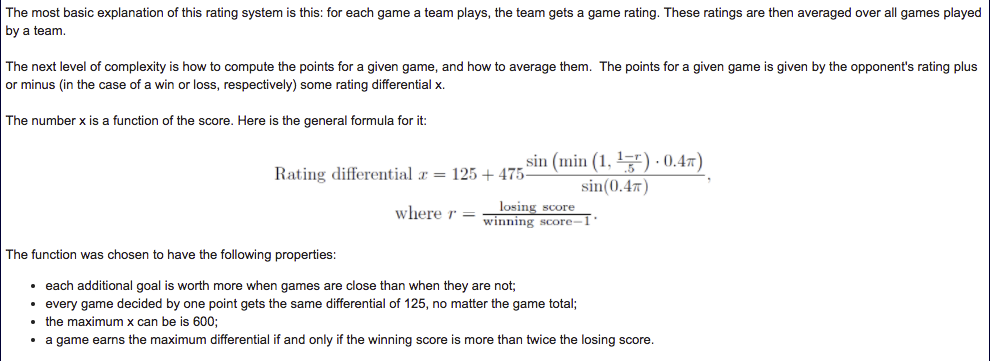
The results on this page ("USAU") are the results of an implementation of the USA Ultimate Top 20 algorithm, which is used to allocate post season bids to both colleg and club ultimate teams. The data was obtained by scraping USAU's score reporting website. Learn more about the algorithm here. TL;DR, here is the rating function. Every game a team plays gets a rating equal to the opponents rating +/- the score value. With all these data points, we iterate team ratings until convergence. There is also a rule for discounting blowout games (see next FAQ)
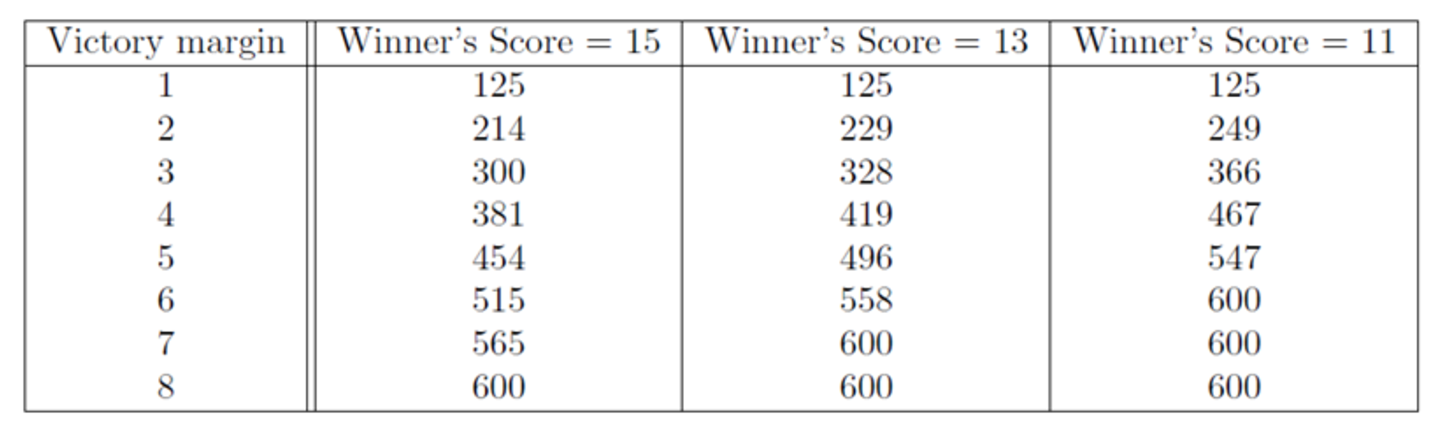
For reference, here is handy table with frequent game scrores and the resulting game value:
"...if a team is rated more than 600 points higher than its opponent, and wins with a score that is more than twice the losing score plus one, the game is ignored for ratings purposes. However, this is only done if the winning team has at least N other results that are not being ignored, where N=5."

Translation: if a team plays a game where even earning the max point win would hurt them, they can have the game ignored provided they win by enough and have suffficient unignored results.